What Is Median in Maths?
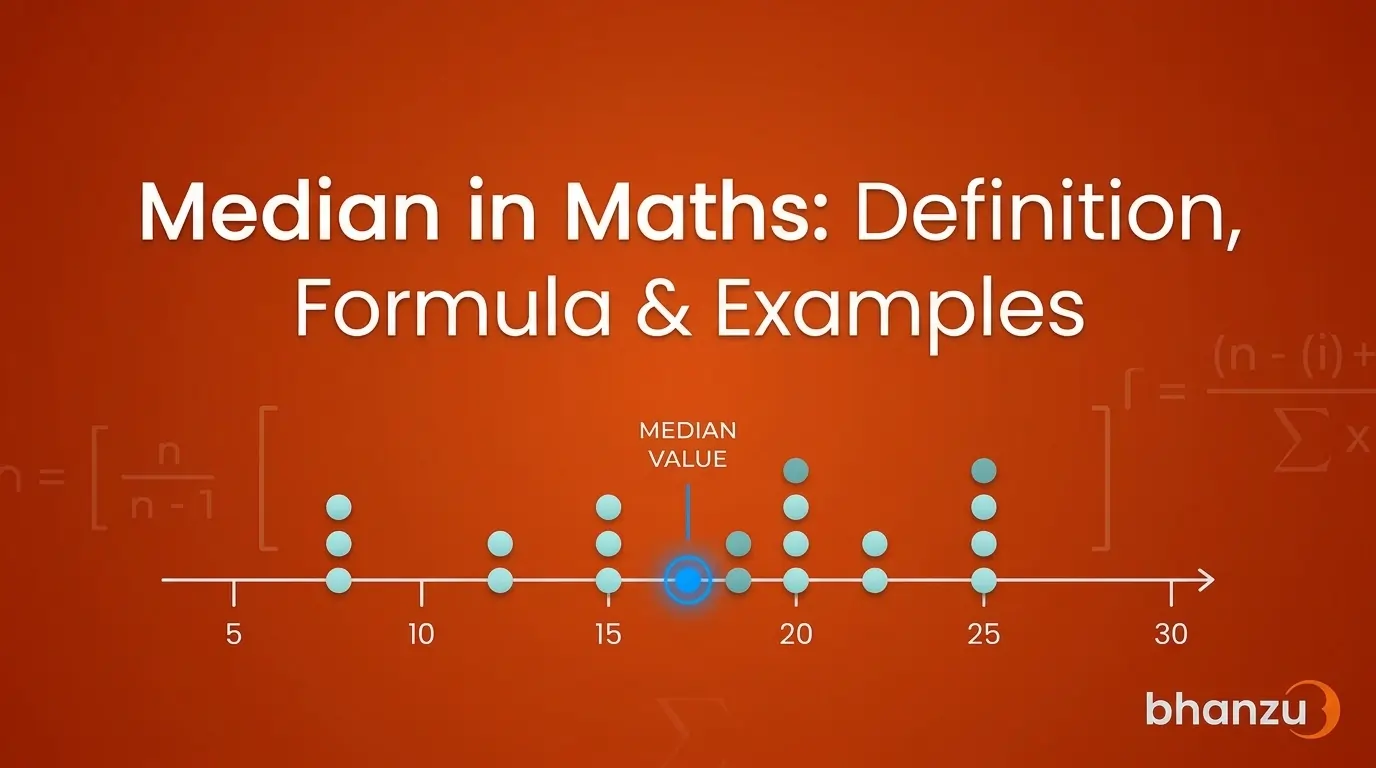
The median is the middle value of an ordered data set. It is one of three measures of central tendency in statistics, alongside the mean and the mode. The median first appears in school mathematics around Grade 6 (CCSS 6.SP.A.3) in the United States and Class 7 in the Indian NCERT curriculum.
When a data set has an odd number of values, the median is the single value at the centre after arranging the data in ascending order. When the data set has an even number of values, the median is the average of the two middle values.
Median Formula
The median formula depends on whether the data is ungrouped (a raw list of values) or grouped (organised into class intervals).
Median Formula for Ungrouped Data — Odd Number of Observations
When the number of observations (n) is odd:
Median = ((n + 1) / 2)ᵗʰ term
The median is the value at position (n+1)/2 in the ordered data set.
Median Formula for Ungrouped Data — Even Number of Observations
When the number of observations (n) is even:
Median = [(n/2)ᵗʰ term + ((n/2) + 1)ᵗʰ term] / 2
The median is the average of the two middle values.
Median Formula for Grouped Data
For data organised into class intervals:
Median = l + [((n/2) − cf) / f] × h
Variable | Meaning | Where to Find It in the Frequency Table |
|---|---|---|
l | Lower limit of the median class | Class interval column |
n | Total number of observations | Sum of all frequencies |
cf | Cumulative frequency of the class before the median class | Cumulative frequency column |
f | Frequency of the median class | Frequency column |
h | Class size (width of each interval) | Difference between upper and lower limits of any class |
The median class is the class interval whose cumulative frequency first reaches or exceeds n/2.
How to Find the Median (Step by Step)
Step-by-Step for Ungrouped Data
Arrange the data in ascending order.
Count the number of observations, n.
Check whether n is odd or even.
Apply the appropriate formula.
Example (odd n): Find the median of 7, 3, 9, 5, 11.
Arranged: 3, 5, 7, 9, 11
n = 5 (odd)
Median = ((5+1)/2)ᵗʰ term = 3ʳᵈ term = 7
Example (even n): Find the median of 4, 6, 8, 10.
Arranged: 4, 6, 8, 10
n = 4 (even)
Median = (2ⁿᵈ term + 3ʳᵈ term) / 2 = (6 + 8) / 2 = 7
Step-by-Step for a Discrete Frequency Distribution
When data is given as values with their frequencies (but not as class intervals):
Build a cumulative frequency column.
Find n/2, where n is the total of all frequencies.
Locate the value where the cumulative frequency first reaches or exceeds n/2.
That value is the median.
Example: The number of children in 20 households is recorded.
Children | Frequency (f) | Cumulative Frequency (cf) |
|---|---|---|
0 | 2 | 2 |
1 | 5 | 7 |
2 | 8 | 15 |
3 | 3 | 18 |
4 | 2 | 20 |
Total n = 20. n/2 = 10. The cumulative frequency first reaches or exceeds 10 at the value 2 (cf = 15). The median number of children is 2.
Step-by-Step for Grouped Data
When data is given in class intervals:
Build a cumulative frequency column.
Find n/2, where n is the total of all frequencies.
Identify the median class — the class whose cumulative frequency first reaches or exceeds n/2.
Identify the values of l, cf, f, and h from the table.
Apply the grouped data formula.
Median Examples
Example 1 — Median of Odd-Count Data
Find the median of: 12, 5, 8, 21, 3, 17, 9.
Arrange in ascending order: 3, 5, 8, 9, 12, 17, 21.
n = 7 (odd)
Median = ((7+1)/2)ᵗʰ term = 4ᵗʰ term = 9
Median = 9
Example 2 — Median of Even-Count Data
Find the median of: 24, 18, 30, 12, 28, 16.
Arrange in ascending order: 12, 16, 18, 24, 28, 30.
n = 6 (even)
Median = (3ʳᵈ term + 4ᵗʰ term) / 2 = (18 + 24) / 2 = 21
Median = 21
Example 3 — Median of a Discrete Frequency Distribution
The marks scored by 25 students in a quiz are recorded.
Marks | Frequency (f) | Cumulative Frequency (cf) |
|---|---|---|
5 | 3 | 3 |
6 | 5 | 8 |
7 | 7 | 15 |
8 | 6 | 21 |
9 | 4 | 25 |
n = 25. n/2 = 12.5. The cumulative frequency first crosses 12.5 at marks = 7 (cf = 15).
Median = 7
Example 4 — Median of Grouped Data (Class Intervals)
The heights (in cm) of 50 students are recorded in the following frequency distribution.
Height (cm) | Frequency (f) | Cumulative Frequency (cf) |
|---|---|---|
140 – 150 | 6 | 6 |
150 – 160 | 12 | 18 |
160 – 170 | 18 | 36 |
170 – 180 | 10 | 46 |
180 – 190 | 4 | 50 |
n = 50. n/2 = 25.
The cumulative frequency first reaches or exceeds 25 in the class 160–170 (cf = 36). The median class is 160–170.
From the table:
l = 160 (lower limit of median class)
cf = 18 (cumulative frequency of the class before the median class)
f = 18 (frequency of the median class)
h = 10 (class width)
Apply the formula:
Median = 160 + [(25 − 18) / 18] × 10
Median = 160 + (7/18) × 10
Median = 160 + 3.89
Median ≈ 163.89 cm
When to Use Median (Instead of Mean or Mode)
The median is preferred over the mean when a data set contains outliers or is skewed.
Consider the monthly salaries of five employees in a small company: ₹30,000, ₹32,000, ₹35,000, ₹38,000, and ₹500,000.
The mean is (30,000 + 32,000 + 35,000 + 38,000 + 500,000) / 5 = ₹127,000. This figure is misleading — four out of five employees earn less than a third of this amount. The single high salary (an outlier) has pulled the mean upward.
The median, by contrast, is ₹35,000 — the middle value when the salaries are ordered. This is far closer to what a typical employee in this group earns. The median is unaffected by the outlier because it depends only on position, not on magnitude.
For this reason, official statistics on income, house prices, and survival data typically report the median rather than the mean.
Median vs Mean vs Mode
All three are measures of central tendency, but each describes a different aspect of the data.
Measure | What It Is | When to Use | Value for Data: 2, 4, 4, 6, 100 |
|---|---|---|---|
Mean | Sum divided by count | Symmetric data, no outliers | 23.2 |
Median | Middle value when ordered | Skewed data, outliers present | 4 |
Mode | Most frequent value | Categorical data, repeated values | 4 |
The data set {2, 4, 4, 6, 100} shows the difference clearly. The outlier (100) pulls the mean up to 23.2 — a value larger than every observation except one. The median (4) and mode (4) both stay at the centre of the bulk of the data.
Common Confusions About Median
The median doesn't always appear in the data set. For an even number of observations, the median is the average of the two middle values — and that average may not itself be a value in the original list. The median of {4, 6, 8, 10} is 7, even though 7 is not in the data set.
The median can be a decimal. When averaging two middle values, the result may be a non-integer. The median of {3, 5, 8, 12} is (5+8)/2 = 6.5.
The median is a value, not a position. Students sometimes report the position number — "the 3rd term" — instead of the value at that position. The median is the value found at the middle position, not the position itself.
The median class is a class, not a number. In grouped data, the median class is the class interval that contains the median (e.g., "20–30"). The median itself is a single number computed from the formula, not the class interval.
The median is not the midrange. The midrange is the average of the smallest and largest values in the data set. The median is based on the middle position after ordering. These are two different measures.
Related Terms
Term | Meaning | How It Relates to Median |
|---|---|---|
Mean | Sum of values divided by count | Different measure of central tendency; affected by outliers |
Mode | Most frequently occurring value | Different measure; data can have multiple modes or none |
Range | Difference between largest and smallest values | Measures spread, not centre |
Cumulative frequency | Running total of frequencies | Required to find the median in frequency or grouped data |
Median class | Class interval containing the median in grouped data | Used inside the grouped median formula |
Quartiles | Values that split ordered data into four equal parts | The median is the second quartile (Q₂) |
Central tendency | Measures describing the centre of a data set | Median is one of three central tendency measures |
Curriculum Alignment
In the United States, median is introduced in Grade 6 under the Common Core State Standards (CCSS 6.SP.A.3) within the Statistics and Probability strand. It is extended in Grade 7 (CCSS 7.SP.B.4) for comparing populations.
In India, the NCERT curriculum introduces median for ungrouped data in Class 7 (Data Handling). Median for grouped data with class intervals appears in Class 10 Statistics.
In the United Kingdom, the National Curriculum introduces the median in Key Stage 3 under the Statistics strand, alongside the mean, mode, and range.
Was this article helpful?
Your feedback helps us write better content